Project Description
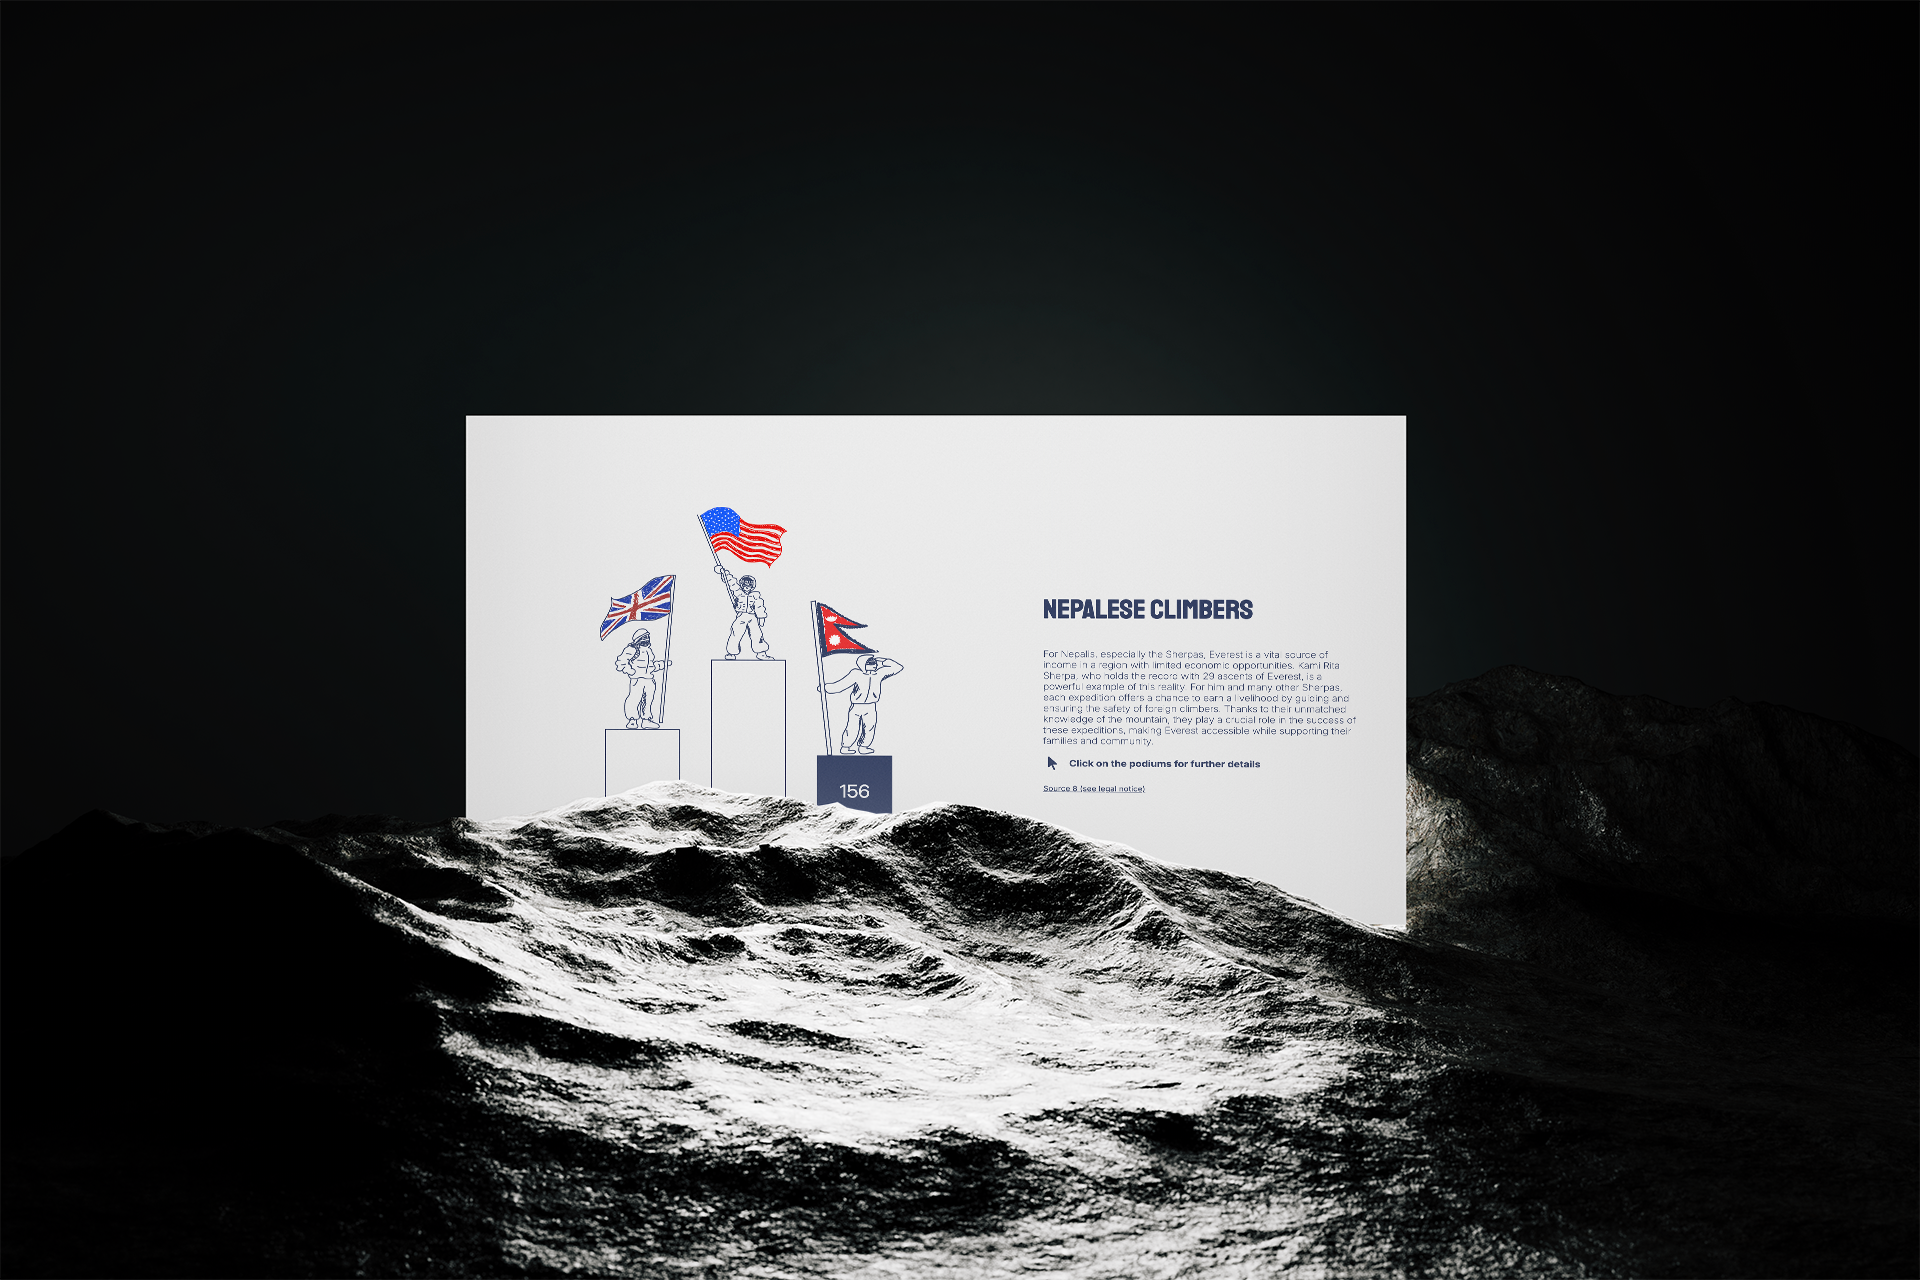
The Everest Dataviz project is an interactive data visualization application designed to
showcase my ability to work with complex JavaScript libraries like D3.js. The primary
objective of this project was to create visually compelling and intuitive charts that
present data in a meaningful way. Initially, the steep learning curve of D3.js and its
extensive documentation presented a significant challenge. However, after watching
several tutorial videos and studying the materials provided by our JavaScript
instructor, I was able to overcome these difficulties. This experience not only enhanced
my understanding of data visualization techniques but also improved my ability to manage
intricate coding tasks effectively. The project now serves as a cornerstone of my
portfolio, demonstrating my growth as a developer and my dedication to mastering new
technologies.
Solution
At first, tackling the Everest Dataviz project felt daunting due to the complexity of
D3.js and its unconventional approach to DOM manipulation. Understanding the library’s
methods and the underlying concepts required a significant investment of time.
Thankfully, our professor’s course and a series of online tutorials provided the
guidance I needed to navigate through the intricacies of D3.js. By breaking the project
into smaller tasks and experimenting with various features of the library, I gradually
gained confidence in building dynamic and responsive visualizations. This project has
been a pivotal learning experience, solidifying my skills in data visualization and
reinforcing my ability to tackle technically demanding challenges with persistence and
resourcefulness.